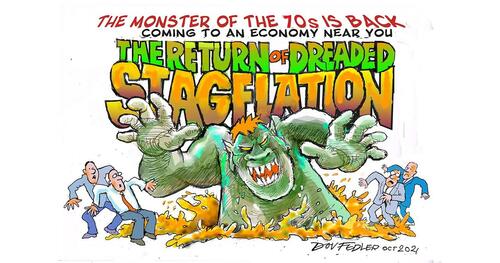
"We're One Event Away From A 1970s-Style Stagflation Explosion..."
Excerpted from 'The Turning Point' report via Larry MacDonald's TheBearTrapsReport.com,
We hear the comparisons more and more; they are growing louder by the week.
“The years 2023-2024 look a lot like 1973-1974.”
The history books remind us,1973’s oil embargo shook the global energy market. It also reset geopolitics, reordered the global economy, and a multipolar world saw energy weaponized. After kissing 6% in 1970, in Q1 of 1973, inflation as measured by CPI danced just below 4%, much like today, central bankers were doing the Michael Jackson moonwalk in celebratory form. Then, in bloodcurdling fashion in late 1974, CPI breached 12%.
“Don’t be silly, 1973 was a far different set up,” we are told.
When it comes to demand on a global stage, 2024 is 2x 1973.
Above all, the U.S. is the largest producer of oil in 2024, not as was the case in 1973, when she was the world’s largest petroleum importer.
At the time, oil was 50% of world energy consumption vs. 1/3 today.
There is just one overwhelming difference today.
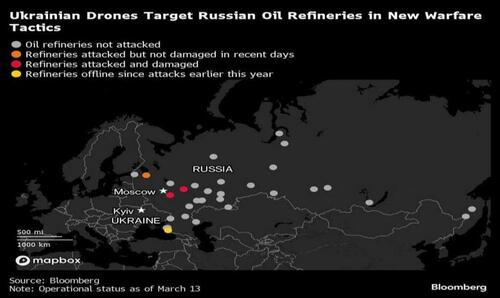
In the last 8 weeks, we have seen drone technology knock out
a) parts of Russia’s second largest airport,
b) at least three of Putin’s prize oil refineries,
and c) countless ships in the Suez Canal.
Weaponizing oil in a multipolar world is exponentially more uncertain with James Cameron calling the shots. In October of 1984, he brought us the “Terminator” and opened the world’s eyes to the future of AI and the weaponization of robots. If Vladimir Putin, on the eve of an election, cannot protect his second-largest airport, how can the Saudi’s protect their own crown jewel. Measuring 280 by 30 km (170 by 19 mi) (some 8,400 square kilometres (3,200 sq mi)), it is by far the largest conventional oil field in the world. That’s a lot of ground to protect. We are one event away from a 1970s-style stagflation explosion.
More often than not, recency bias is an investor’s foe. The 2008 and 2020 recessions were similar in that a shock triggered a colossal bond rally along with plunging PMI, ISM and LEI data. It’s more and more apparent by the minute. What we are experiencing today is much more of a 1970s – 1980s recession vintage. An inflation-driven slowdown hits the bottom 60% first, but this time around after the Fed suppressed rates for so, so, so long, higher net worth consumers feel like they died and went to heaven. Revenge consumption has been the economy’s tailwind from those with $1m ($50k annual income vs. $8k in 2021) to $10m ($500k annual income vs. $80k in 2021) in a money market fund. This, plus trillions of fiscal overdosing coming out of Washington have prevented the recession so far, but they have also made inflation’s second act far more certain in a multipolar world.
In this note we breakdown the increasing stagflationary landscape.
By our count, $500B has moved into Oil & Gas and Metals in recent months. Likewise, oil’s risk to inflation expectations, rates and the -- CRE wounded -- super regional banks is accelerating.
What does the world look like if the Fed is forced to ease to protect the banks and the bottom 60% of consumers in an election year -- while inflation is heading north for the summer?
Sticky Inflation
Both CPI on Tuesday and PPI on Thursday came in hotter than expected.
Core CPI rose 3.8% y/y vs +3.7% expected and PPI rose 2% y/y vs 1.9% expected. At the same time, several data points show a slowing economy as well. Retail sales, which were reported simultaneous with the PPI on Thursday, rose 0.6% m/m, which was less than the 0.8% forecast. The prior month was revised lower as well, from -0.8% to -1.1%.
In ANOTHER stagflationary turn, the Empire State manufacturing survey for March also came in well below expectations at -21 vs -7 expected.
The report noted that “Demand softened as new orders declined significantly, and shipments were lower. Unfilled orders continued to shrink. Labor market indicators weakened, as employment and hours worked both decreased. The pace of input price increases moderated somewhat, while the pace of selling price increases held steady”.
BofA in its monthly consumer spending report on Monday said that” consumer spending momentum appears soft, Credit card and debit card spending rose 0.4% m/m, after a 0.3% drop in January.”
Oil – High Impact Far and Wide
The oil heavy CRB touched its highest level since November Friday. Every day the super-regional banks go without rate cuts, the day of reckoning on market-tomarket losses grows closer to a reality. The Fed opened the door to a softer path, just an inch – that has fueled inflation’s Act II.
This has LARGE implications for the banks.
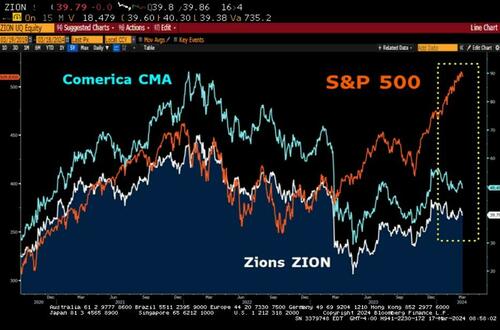
Since January 2023; Zions ZION, Comerica CMA and Truist TFC are underperforming the S&P 500 by close to 50%.
The NYCB failure has regulators at the OCC and FDIC on the lookout for other Mark-to-Market cheaters.
In recent days, we have multiple Ukraine drone attacks on Russian oil refineries, another over the weekend.
A multipolar world takes some of the steering wheel away from the Fed with large implications for the banks.
Multipolar World - Drone Strikes with High Impact
By some estimates, in 2023 the EU imported 130 million barrels of seaborne refined products – mostly diesel – from refineries processing Russian crude.
These purchases were worth an estimated €1.1 billion. With some Russian refineries down, Europe must draw more supply from the West, WTI is more than +13% off February levels, +20% off the December lows.
The refineries that are processing Russian crude oil and exporting to the EU are largely the same ones sending laundered Russian fuel to the UK and US.
The seven largest refineries collectively processed 390 million barrels of Russian crude oil in 2023, valued at an estimated €23 billion. (Global Witness).
Connecting the Dots
Higher rates + higher inflation expectations are leaving a stain here. Some banks desperately need rate cuts.
Where does that leave us?
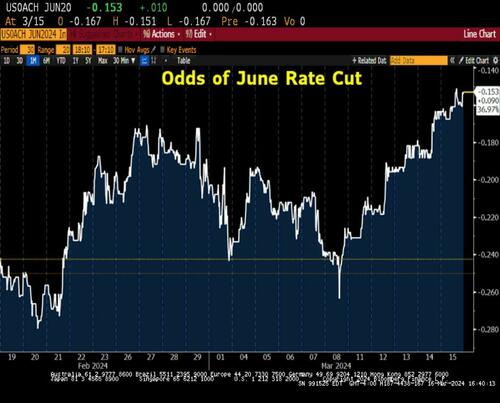
The anxious bond market is now pricing in just 60% odds a rate cut in June and 72bp of rate cuts in 2024. In the upcoming FOMC meeting, some economists are now forecasting the DOT plot to move from 3 to 2 cuts this year.
It only takes two Committee members to raise their dot for the median dot to go from 3 cuts to 2 cuts for the year.
Odds of Rate Cut
The higher the white line above the lower the June rate cut probability.
We are back where we were in late February, with June rate hike odds at 60%.
(The market prices these odds as an expected move in the Fed Fund futures. So -15bp is a 15bp/25bp=60% chance of a 25bp drop in Fed Funds.)
...
"Funny how Nicky-Leaks only mentions the dovish data, failed to mention the Atlanta Fed sticky CPI data out yesterday which showed nice reacceleration" -- Dallas PM.
* * *


